NCUA Board Meeting: CAMELS 3/4/5 Continue to Rise, Driven by Larger Credit Unions

Happy NCUA Board Meeting Thursday everyone! The NCUA had a full agenda for its Board meeting today after their normal August break. The Board received the quarterly Share Insurance Fund briefing, which is a rare look at publicly available data on CAMELS codes of credit unions. The data showed the continuing trend of an increasing number of credit unions with CAMELS codes of 3, 4, and 5, as well as the growing number of assets in those credit unions. The Board also approved two new final rules, which we'll be covering in a subsequent post. Today we're taking a look at some of the key points from the share insurance briefing. Let's dive in.
Slide 9 of the briefing shows the percentage of insured shares and total number of CUs by CAMELS code. At the end of Q2 2024, there were 4,533 credit unions. Of them, 743 were CAMELS code 3 and 136 were CAMELS code 4 or 5. CAMELS 3 credit unions held 9.04% of total credit union insured shares - up from 8.61% in Q1 2024 and up from 2.33% at the end of 2021. The 136 CAMELS code 4/5 credit unions held 0.97% of the total credit union assets - up sharply from 0.35% in Q1 2024. This is the first time in recent years that the total % of insured shares held by CAMELS code 1/2 has fallen below 90%, albeit by 0.01%.
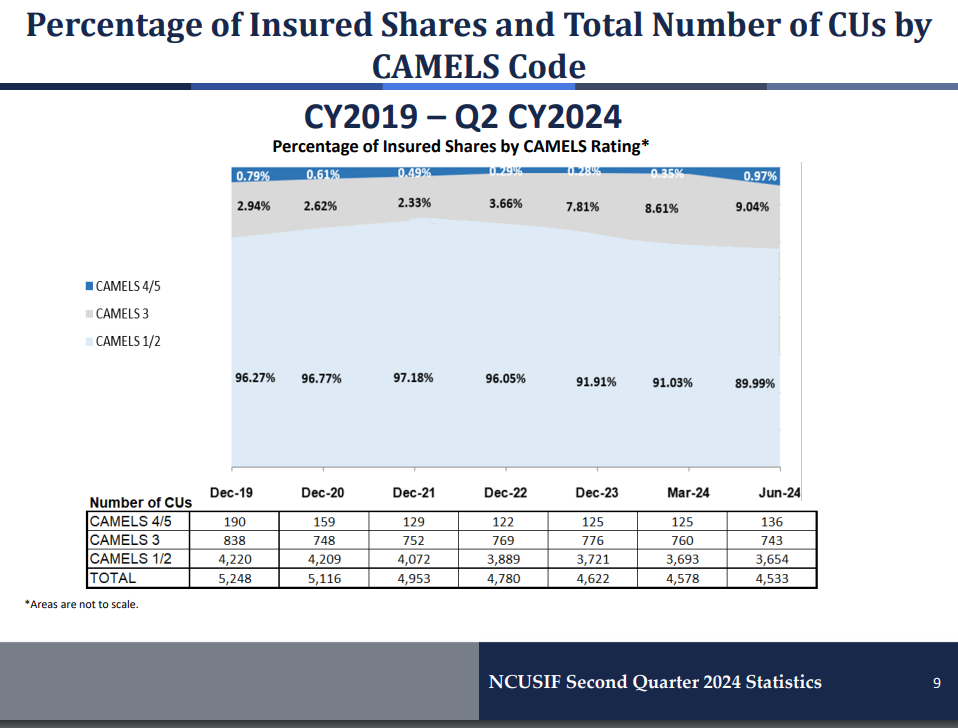
Slide 10 of the briefing shows us some additional details on the asset sizes of CAMELS code 3/4/5 credit unions. In this slide, we can see why the % of insured shares in CAMELS 4/5 credit unions increased this quarter - the number of CAMELS 4/5 credit unions with total assets greater than $500 million increased from 3 to 9. The total assets of these credit unions increased from $2.6 million to $13.8 billion. CAMELS 3 credit unions with greater than $500 million in total assets also saw a slight increase - from 62 credit unions with $116.3 billion in total assets to 66 credit unions with $127.0 billion dollars. For credit unions with less than $500 million in total assets, the number of CAMELS 3/4/5 and the total assets of those credit unions remained relatively stable.
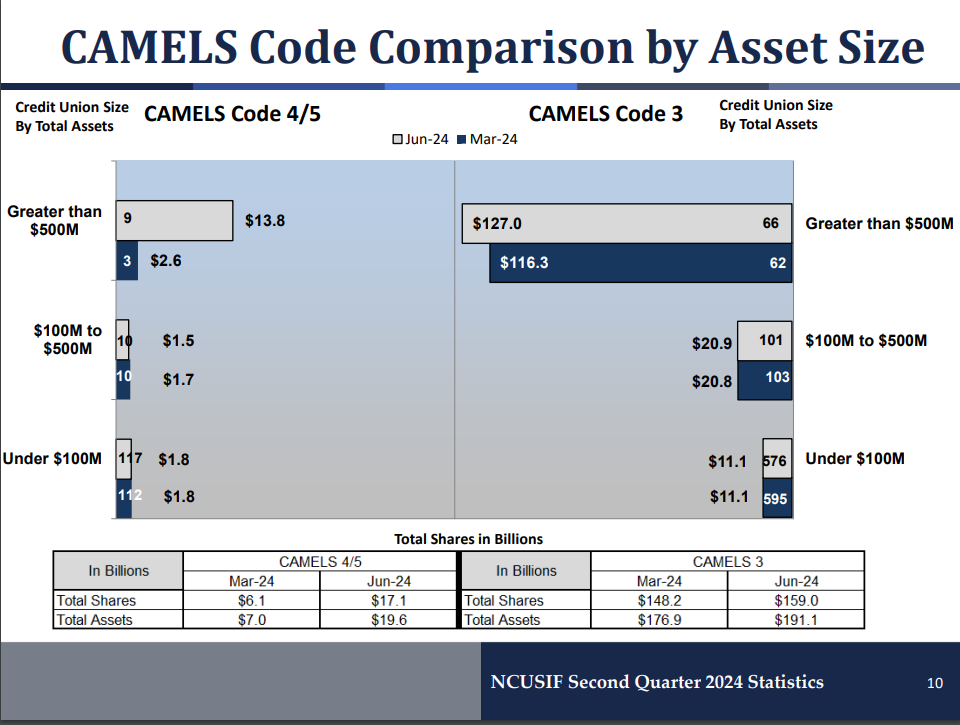
Slide 5 of the briefing shows the number of credit union failures causing a loss to the share insurance fund as well as the amount of those losses. Q2 saw two credit union failures that led to a loss of $2.02 million. In the briefing NCUA staff noted that both of these failures were assisted mergers and that fraud was not a contributing factor to either failure.
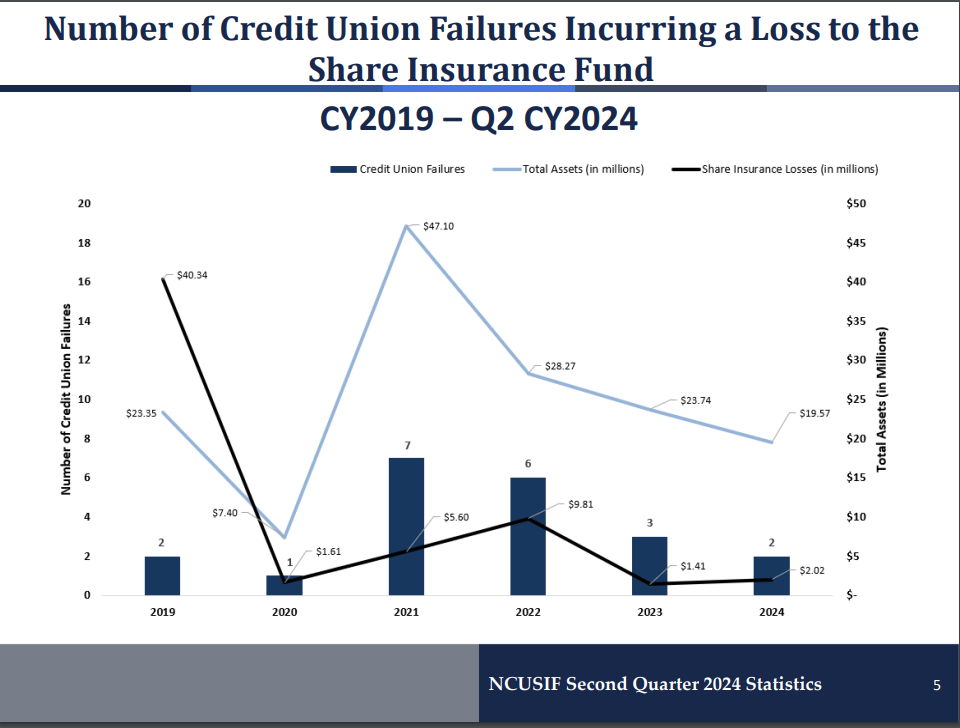
In his questions, Chairman Harper noted that approximately one out of five credit unions is now a CAMELS code 3, 4, or 5, and described many of the data points in the briefing as "warning signs." The growth in these categories will certainly be something the NCUA Board will continue to keep a close eye on going forward.
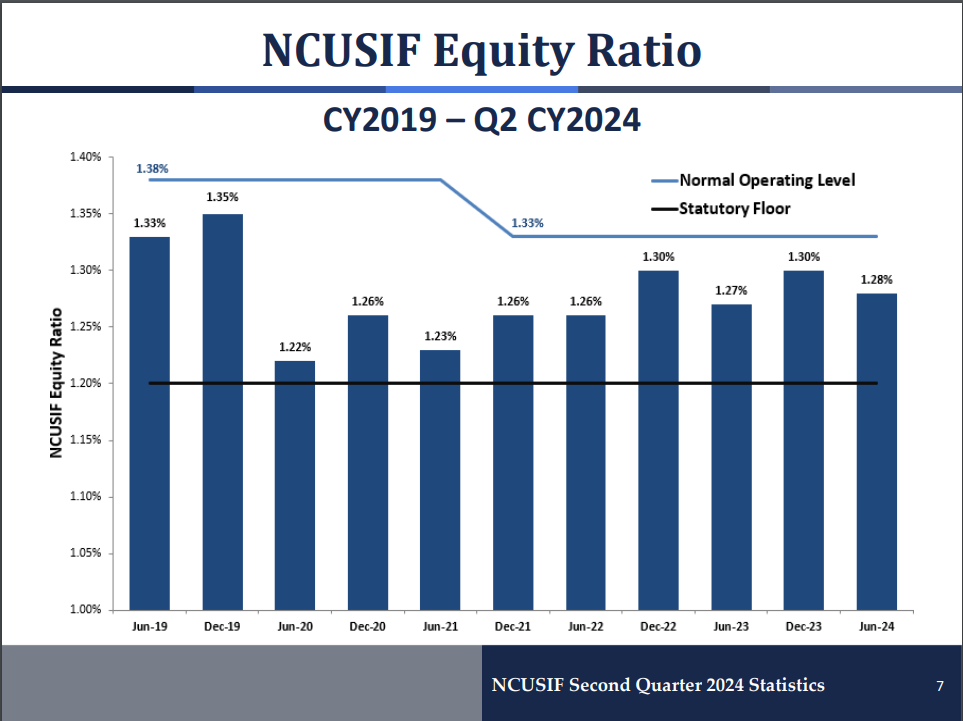
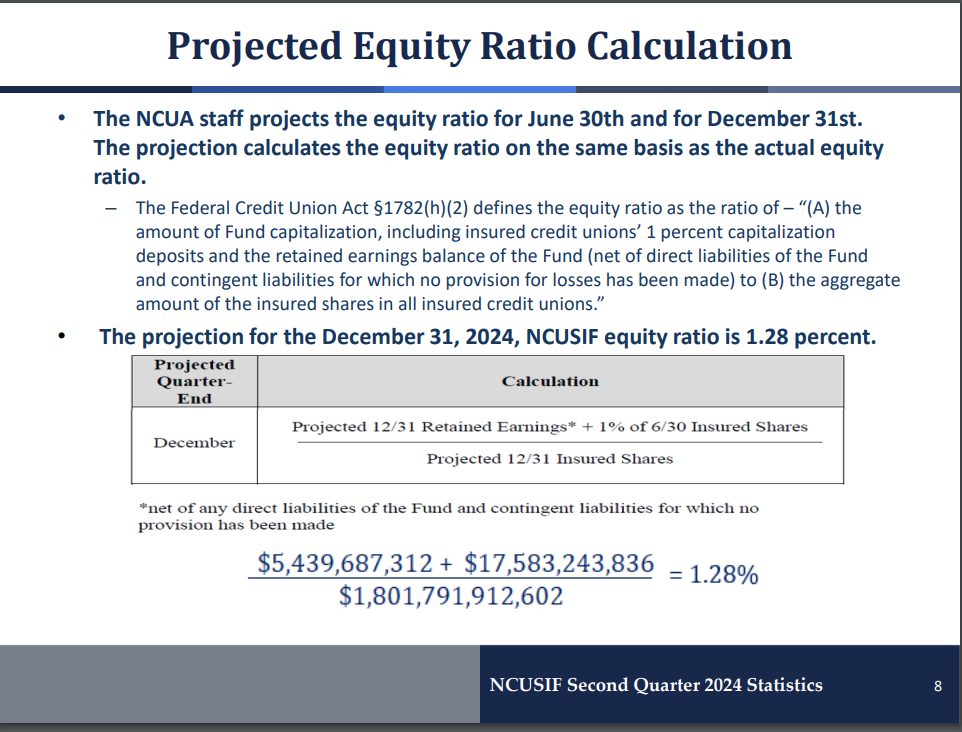
On slides 7 and 8 we received some data on the NCUA's Equity Ratio. The equity ratio came in at 1.28% for June 2024. The agency also projects the fund to end the year at 1.28%, as shown on slide 8. This would be a slight decrease from the year-end ratios for 2022 and 2023, both of which were 1.30%.
That's all for now - our next post will cover the two final rules issued by the Board in their meeting today.
- Share on Facebook: NCUA Board Meeting: CAMELS 3/4/5 Continue to Rise, Driven by Larger Credit Unions
- Share on Twitter: NCUA Board Meeting: CAMELS 3/4/5 Continue to Rise, Driven by Larger Credit Unions
- Share on LinkedIn: NCUA Board Meeting: CAMELS 3/4/5 Continue to Rise, Driven by Larger Credit Unions
- Share on Pinterest: NCUA Board Meeting: CAMELS 3/4/5 Continue to Rise, Driven by Larger Credit Unions
« Return to "News" Go to main navigation
